Explore Member Data
The Loyalty platform allows you to select one or two of the following assets as a reporting dimension in the People Explorer:
-
Member Attribute: For a Member Attribute to be available to use as a reporting dimension, you must enable the Use as Dimension in People Explorer feature for that Attribute. See Edit Member Attribute for more information.
-
Member Preference: All Member Preferences are automatically available to use as a reporting dimension.
-
Member Function: The platform supports two default Functions: Age Group and Region.
Note: The People Explorer works best when you select a dimension with a relatively small number of distinct values. If you select a dimension with too many values, the donut chart can become unreadable as it may contain many small partitions that are difficult to differentiate. You can also adjust the number of partitions displayed on the screen using the No. of Partitions feature (described below).
To explore your Member data and create a data visualization:
-
Select Audiences from the top navigation bar, then select Members > People Explorer from the side navigation menu.
-
In the Dimension field, select a Member Attribute, Member Preference, or Member Function. The platform generates a donut chart, indicating the distribution of values in the selected asset. Hover your mouse cursor over a section of the donut graph to view additional details.
-
Optionally, repeat the above step to add a second Attribute, Preference, or Function. The platform adds a second ring to the donut chart, allowing you to see the intersection of values between the two selected assets.
-
Optionally, toggle Legend to Off to remove the legend beneath the chart.
-
The No. of Partitions field displays the default number of arcs, or sections, that the platform will display within the donut chart. Optionally, enter a different number in this field; the platform refreshes the chart to show the indicated number of partitions. If the selected asset has more distinct values than the No. of Partitions field, the platform will always display the largest partitions. For example, let's say you selected a Churn Propensity Group Attribute that has ten possible values, but you set No. of Partitions to "5." The platform will display the five largest groups.
Note: The default value for No. of Partitions is controlled by a Program Setting. See Program Setting Category - Explorer for more information on configuring this Program Setting.
-
Optionally, to remove an asset, click the X icon next to it within the Dimension field. The platform refreshes the chart.
-
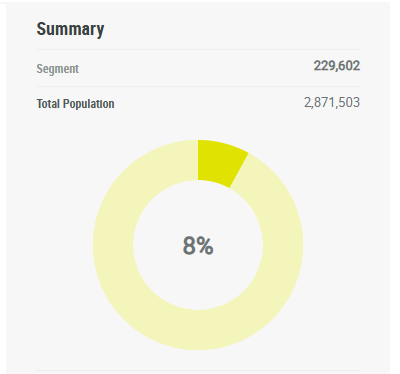
Optionally, to see an exact count of a partition, double-click the partition within the graph. The Summary section along the right-hand side of the screen displays the Member count for this partition, along with a donut graph showing the proportional size of this partition as compared to your entire Member database.